![]()
Provider Saturation
Description
This chart displays the demand percentage per provider for a specified site and duration. Follow the steps described below to view the Provider Saturation
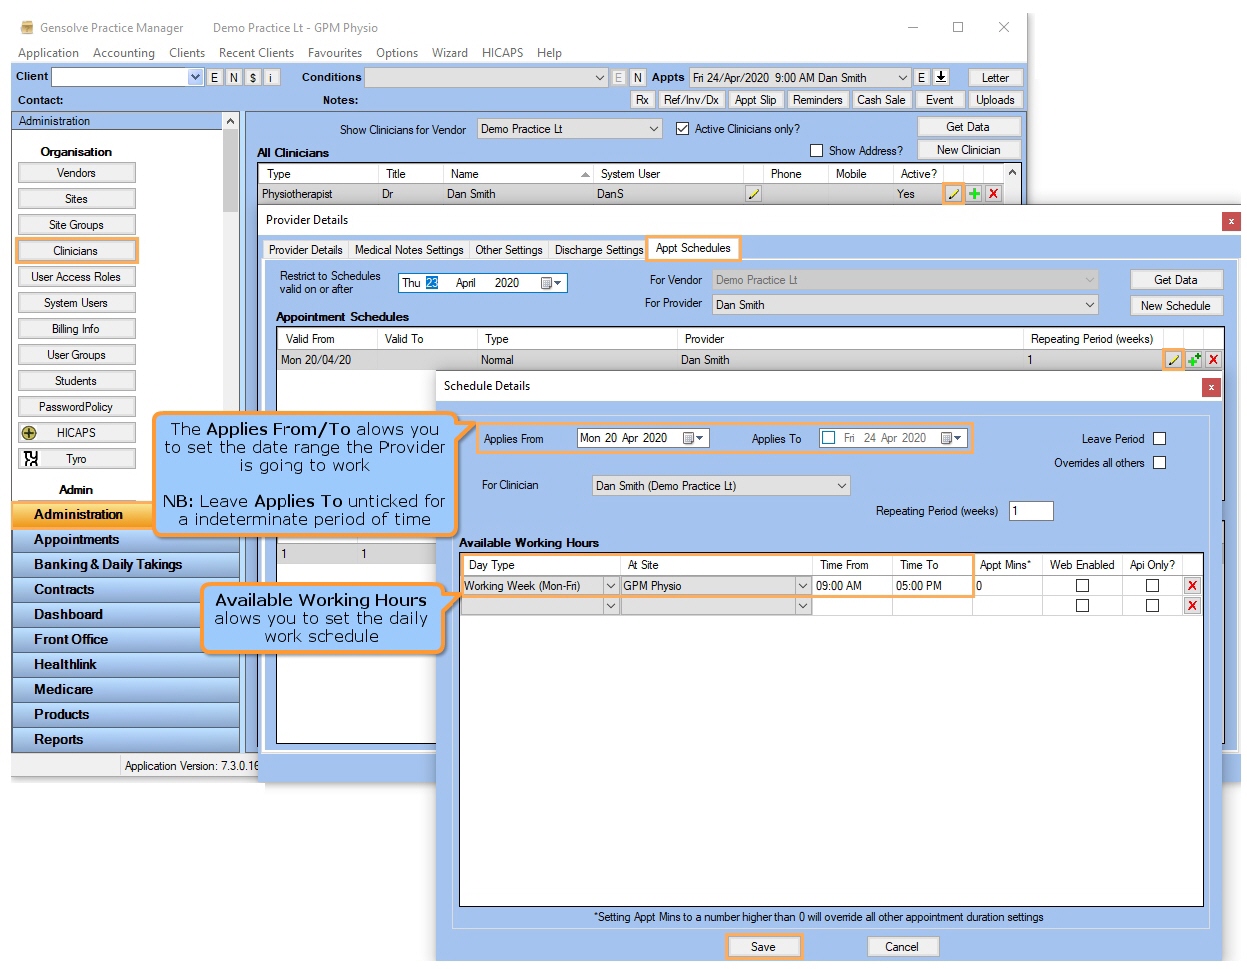
Configure the Clinician
- Go to Administration >> Clinicians
- Click Get Data to retrieve the list of Providers
- Click on
 next to the selected Provider
 - Click on the Appt Schedules tab
- Click on to edit the Appointment
Schedule
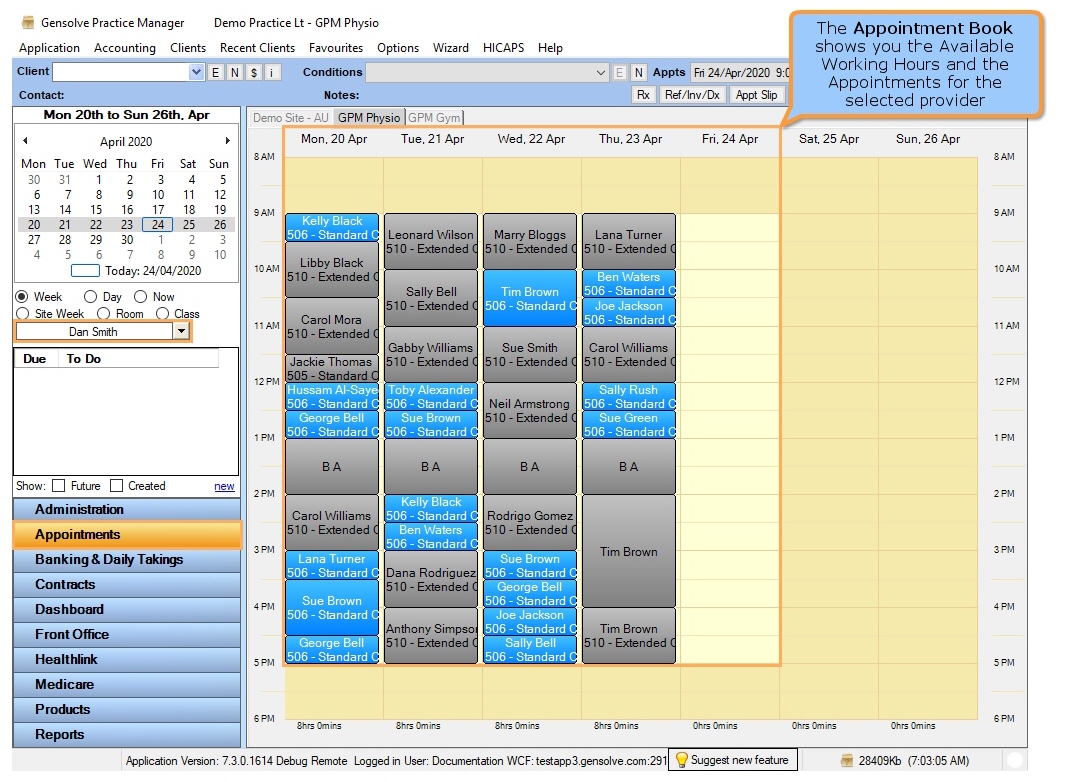
View the Appointment Book
- Go to Appointments
to view all appointments completed within the daily work
schedule
View the Provider Saturation Chart
- Go to GPM Web >> Dashboard
- Click on
 to open the Provider
Saturation
to open the Provider
Saturation
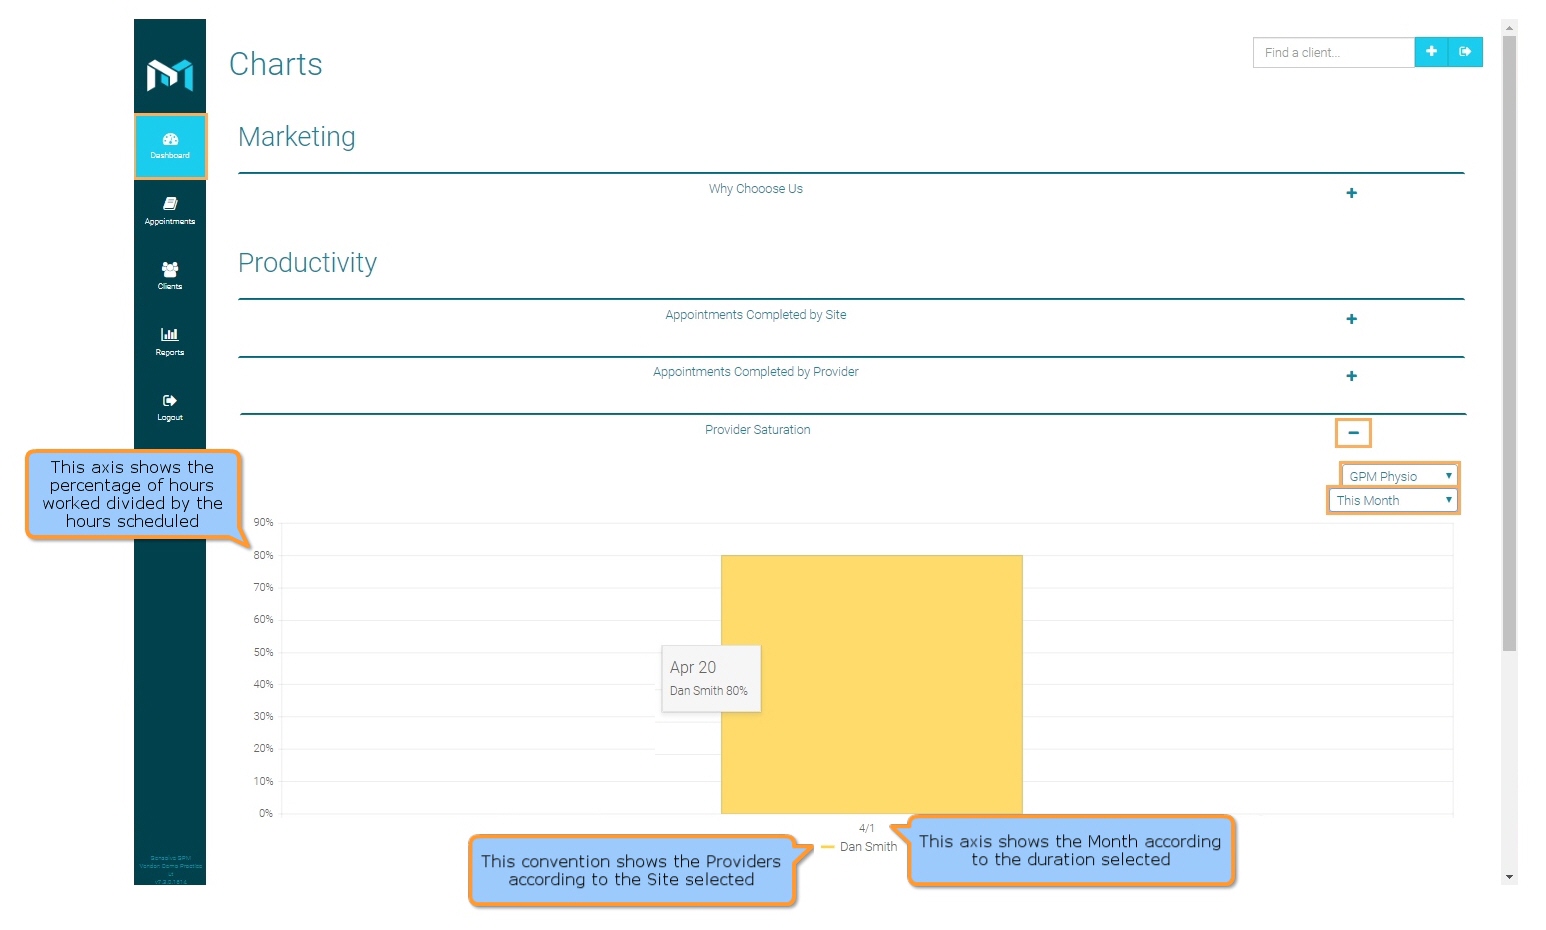
Filters
| Type | Description |
|---|---|
| Duration |
This filter allows you to display the chart data for the last 1, 3, 6 or 12 months. |
| Site |
This filter allows you to display the chart data for a specified Site. |
Chart Data
- X and Y Axis: the X axis (bottom) shows the Months based on the selected duration and the Y axis (left-hand side) shows the percentage of hours worked divided by the hours scheduled.
- Chart: The percentage (Provider Saturation) for a provider is displayed when hovering over the chart.
- Labels: the Providers labels at bottom can be ticked on/off to include/exclude data from the chart.