![]()
Class Saturation
Description
This chart displays the attendance percentage per class for a specified site and duration.
Configure the Class
- Go to Front Office >> Weekly Classes
- Click Get Data to retrieve the list of Classes
- Click on
 to edit the Class
 - Enter the Maximum Clients allowed in the Class
- Click on
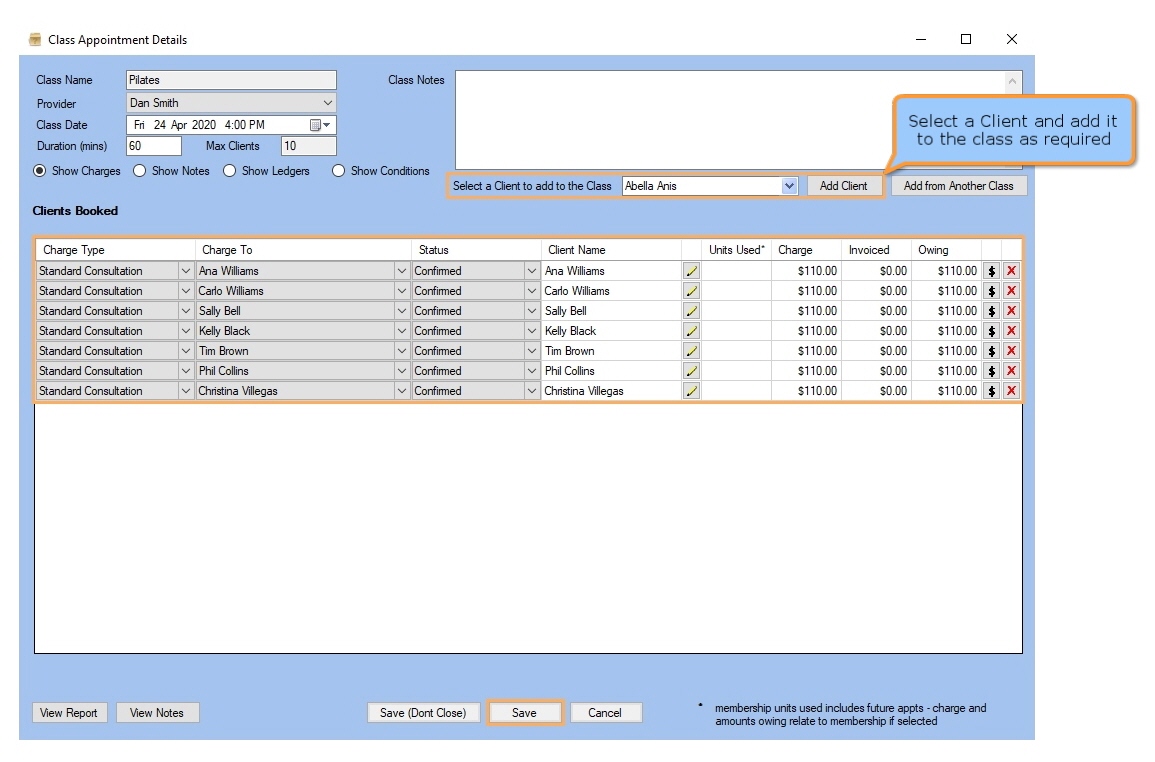
to view the Clients in the Class
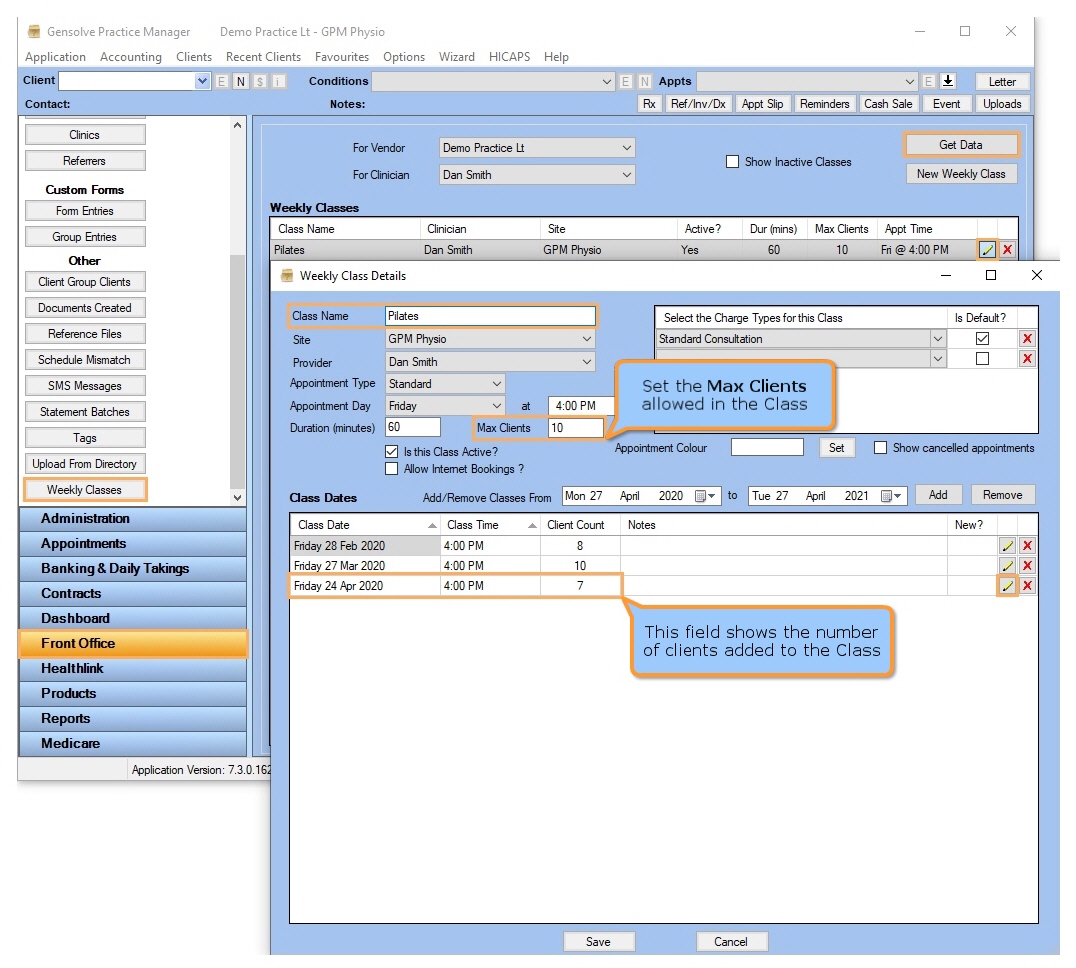
- Select the Client to add to the Class >> Click on Add Client as required
- Click on Save
View the Class Saturation Chart
- Go to GPM
Web
>> Dashboard
>> Class Saturation
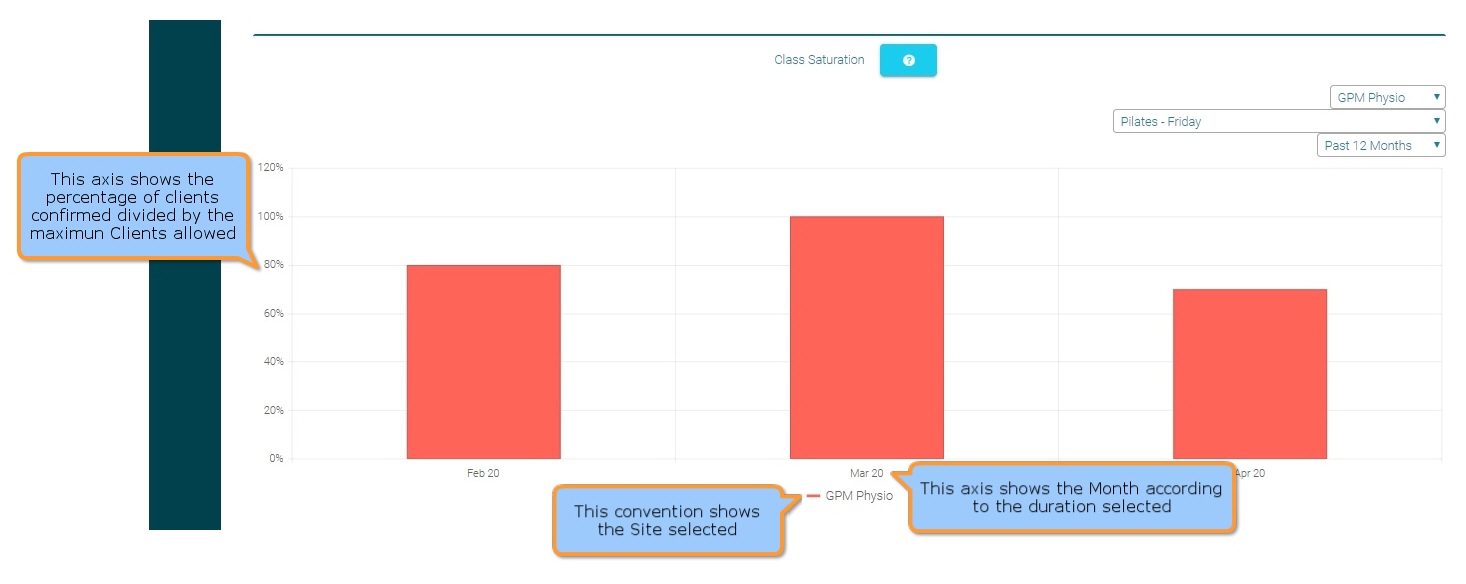
Filters
| Type | Description |
|---|---|
| Duration |
This filter allows you to display the chart data for the last 1, 3, 6 or 12 months. |
| Site |
This filter allows you to display the chart data for a specified Site. |
| Class |
This filter allows you to display the chart data for a specified Class. |
Chart Data
- X and Y Axis: the X axis (bottom) shows the Months based on the selected duration and the Y axis (left-hand side) shows the percentage of clients confirmed divided by the maximum clients allowed.
- Chart: The percentage (Class Saturation) is displayed when hovering over the chart.